Class Three- Statistics
f-admin
Apr 22
1 min read
Updated: Apr 30
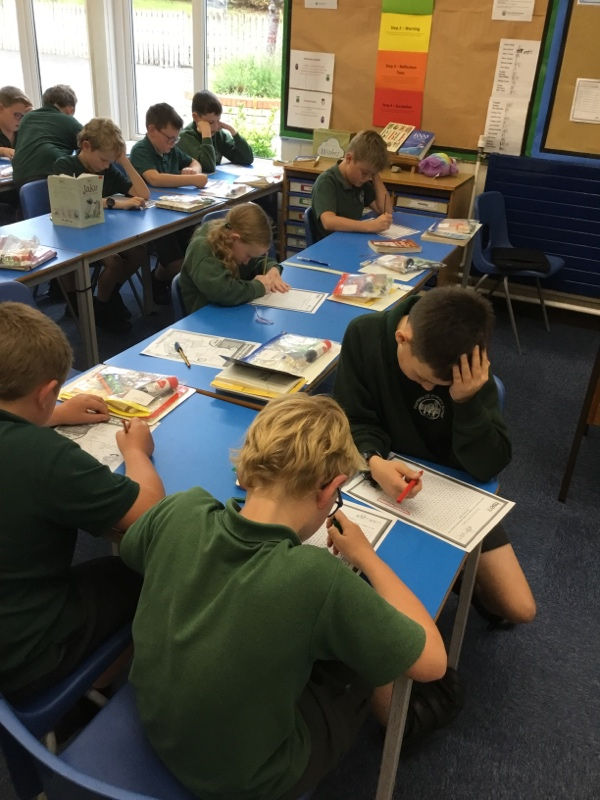
This week in Class Three we have finished our first Maths unit of the term, statistics.
This topic has involved looking at range of graphs: line graphs, bar charts, pie charts, tables and timetables.
The children have practised drawing their own graphs from a given set of data and answering questions and retrieving information from graphs and charts.
Our last lesson was spent looking at the mean. The children understand that the mean means average and to find the mean you add up all the numbers and divide that answer by the number of pieces of data there are.
We are now moving on to converting units.
Have a super weekend!
Mrs Sumner